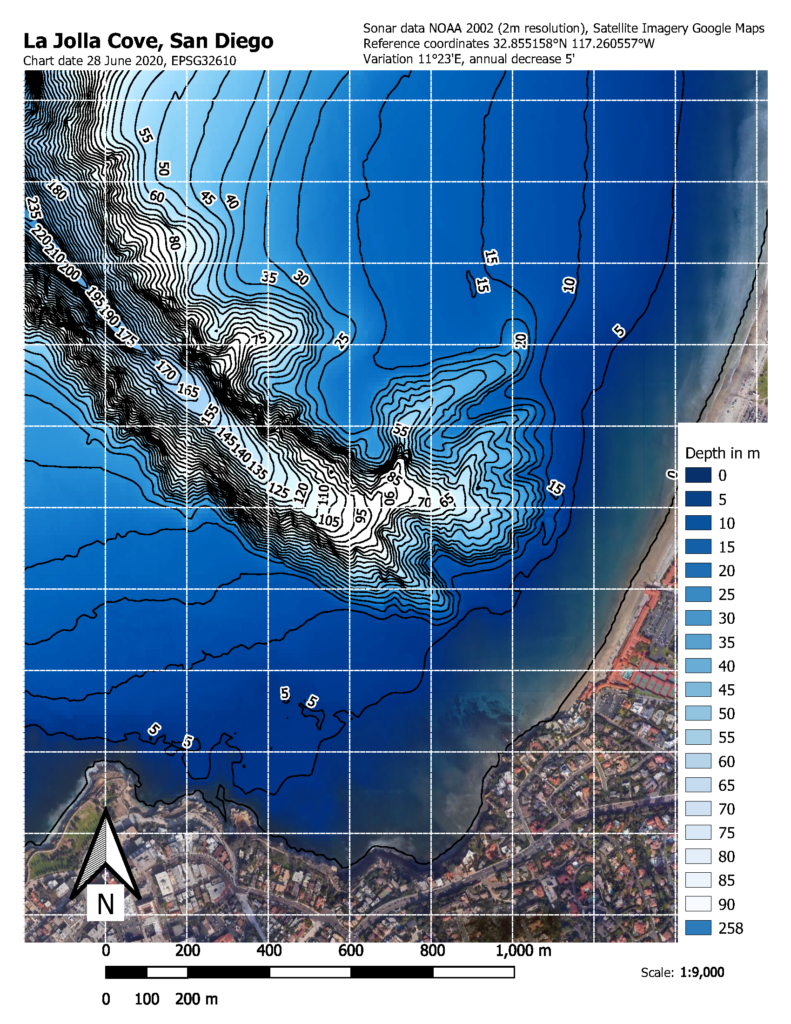
Mapping a dive site is part of every divemaster course. Today, mostly traditional methods are used ranging from using kick cycles and lines to measure distances to using buoyant bottles and a grid of lines or apnea dives to establish depth profiles. While the effort such methods require is laudable and some resulting maps are pieces of art, the resulting spatial accuracy is often poor.
When I was faced with a mapping project in my divemaster course, I wanted to employ modern technology instead. Unfortunately, there were no easy instructions nor an affordable turnkey solution as hydrographic mapping is still considered to be the domain of expert surveyors. In 2020 the author became a PADI instructor and can now share some insights with you.
Several methods to acquire bathymetric data are available today:
- Single-beam sonar (depth below the sensor)
- Side-scan sonar (depth below the sensor and silhouettes of objects on the bottom, see Figure 1 and Figure 2)
- Multi-beam sonar (depths throughout the sonar swath and accurate bottom morphology)
- Re-purposing existing bathymetric survey data
- LiDAR (Light Detection and Ranging) scans in shallow areas

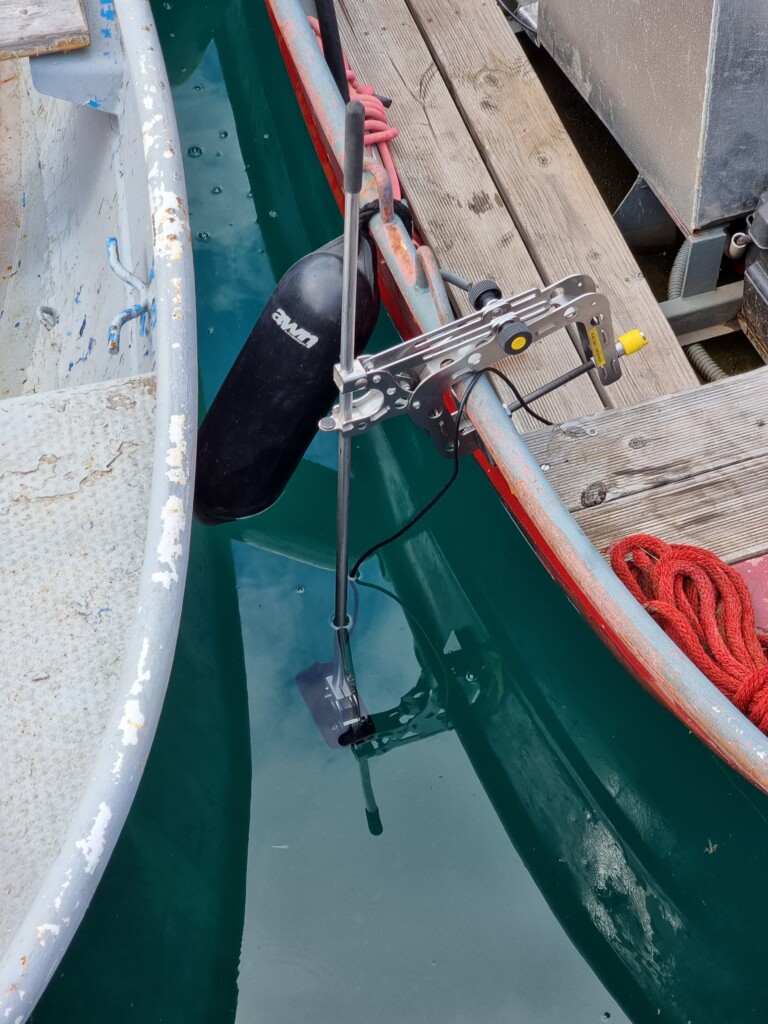
The first step in a mapping project is to identify which area should be mapped and then researching, which of the above techniques can be employed. In this article, we will focus on 4: Re-purposing existing bathymetric survey data as it is the easiest method. Nonetheless, acquiring your own sonar data is feasible and may be the subject of a future article. Good resources for acquiring bathymetric data are:
as well as a growing collection of online open government data.
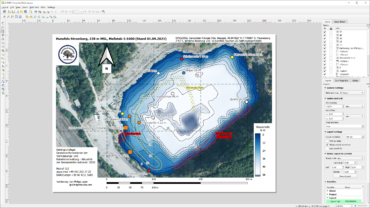
First, the area to be mapped must be defined and a source for the bathymetric data located. For example, NOAA provides a free coastal digital elevation model (DEM) for the San Diego region with 1/3 arc second resolution, i.e. 10 m or 33 ft. Although this DEM is intended for tsunami modeling, we can repurpose it to create high-quality dive site maps of the San Diego coastline. Figure 3 shows the NOAA DEM data imported into QGIS.

On the internet, you can find numerous tutorials on how to clip data sets in QGIS, extracting contours, and assigning symbology, e.g. only to display bathymetry data and to omit any elevations above sea level. The book “Discover QGIS 3.x: A Workbook for Classroom or Independent Study” is highly recommended reading. Once this base layer is available, you can start adding points of interest: entry/exit points, buoys, significant points, and whatever else you deem useful.
If you want to acquire your own data, the cheapest way is to use a castable, inexpensive fishing sonar with GPS sensor. These devices will provide you with X and Y coordinates and the corresponding depth in a CSV file. Deeper makes such sonars (Smart Sonar) starting at about 200 USD. The minimum model you need is the “Deeper Smart Sonar PRO+ with GPS for Professional Fishing” as it is the smallest model equipped with GPS.
Be careful though as not all manufacturers of fishing sonars allow you to download the bathymetric data like Deeper does. Many store the data in proprietary formats, making them hard or even impossible to process.
Before importing a file into QGIS, you need to manually check it for obvious errors, e.g. when the device did not have a satellite-based position, it will often provide data with a position of 00°N/000°E/W. You need to delete these values in the spreadsheet software of your choice.
Once you have the file cleaned up, you can process it directly in QGIS:
1. Import the file as a CSV-Layer
2. Save as Geopackage (makes the next step faster)
3. IDW-Interpolation and save the result as raster
If you are unable to get a CSV file from the device, you may be able to process it with ReefMaster as it supports some proprietary sonar data formats. However, a ReefMaster license costs about 200 USD.
Another consideration is the use of Web Mercator projection in Google Earth, Bing Maps, etc. Web Mercator is not entirely conformal so if you have access to precision instruments like a sextant, real-world angles will slightly differ from what you measure in these online mapping tools. The error is only about 1 to 2° but still something to consider.

You should assemble a team to perform the acquisition of position data for the points of interest. A data acquisition team should consist of at least three people: One person on the surface to log position data and a two-person dive team equipped with a reel or spool, a slate and a small buoyant object to take the slate to the surface. Figure 5 shows a sample work plan for data acquisition in a lake. Each number and red box relates to a coarse position of point(s) of interest that need to be captured. In this example, green boxes indicate missing sonar data that still need to be acquired.
Note: Should you acquire sonar data yourself, it is important not to have any divers in the vicinity of the sonar as bubbles in the water pose a problem for sonar surveys.

The easiest way for the surface team to log the positions and names of the objects is by using a GPS app on a smartphone or tablet, for example GPS Status for Android (see Figure 6). It allows all waypoints to be conveniently saved with their name, coordinates and depth. The resulting data can be exported as a GPX file for further processing in QGIS.

The coordinates are imported into QGIS as a shapefile with points as geometry type. You can then select the desired symbology. Object details can be changed in the layer’s Attribute Table.
To finish your project, you can install the Magnetic Declination QGIS plugin to determine the magnetic declination and its rate of change. These pieces of information as well as a grid/scale/legend need to be added to the Print Layout to generate the final map (see Figure 7 and Figure 8 for examples).
